Web visualisation technology has become an essential tool for conveying complex information in a visually compelling manner.
From interactive graphics to immersive dashboards, web visualisation has transformed the way businesses and organizations interact with their data and present it to their audiences. Here we explore the various aspects of web visualisation technology and its impact on data representation, decision-making, and user engagement.

One of the key advantages of web visualisation technology is its ability to present large and diverse data sets in a way that is easily understandable and actionable. By leveraging interactive charts, graphs, and maps, web visualisation enables users to explore data from different angles, drill down into specific details, and identify trends and patterns that might not be immediately apparent in raw data. This level of interactivity empowers users to make informed decisions based on a deeper understanding of the information at hand.

Furthermore, web visualisation technology has proven to be a powerful tool for communication, through the integration of multimedia elements such as videos, animations, and annotations, web visualisations can provide rich, engaging narratives that captivate and inform. The machine builder can showcase its machine performance metrics, using web visualisation technology and enhance the interaction with the machine or process.
In addition to its communicative power, web visualisation technology is also driving innovation in fields such as business intelligence, data analytics, and scientific research. Advanced visualisation techniques, such as 3D modelling, virtual reality, and augmented reality, are pushing the boundaries of data exploration and interpretation. These technologies enable users to explore complex data sets in a spatial context, leading to new insights and discoveries that would not be possible with traditional two-dimensional visualisations.
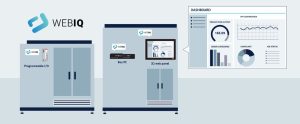
Moreover, the rise of web visualisation software packages, such as WebIQ, has enabled the creation of interactive HMI visualisations. WebIQ is built with open web technologies (OPC-UA, HTML5, CSS, JavaScript) and supports responsive layouts, so your HMI will work on your machine as well as on your tablet.

This software tool provides developers and designers with a platform to build sophisticated and customized web visualisations without the need for extensive programming expertise. As a result, web visualisation technology is becoming more accessible to a wider audience, fostering a culture of data-driven decision-making and creativity.
In conclusion, web visualisation technology is a transformative force in the realm of data representation and communication. Its ability to make complex data understandable, facilitate storytelling, drive innovation, and democratize visualisation creation makes it an invaluable asset for businesses, researchers, and content creators alike. As the technology continues to evolve, the potential for impactful and immersive web visualisations will only continue to grow, shaping the way we interact with and make sense of data on the web.
To learn more about WebIQ, your web based HMI / SCADA system from Beijer Electronics
https://www.beijerelectronics.com/en/Products/Web___HMI___and___SCADA
get in touch :

