By Charlie Walker, Digital Solutions Consultant for SICK UK
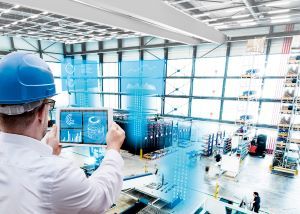
The road to digitilisation is littered with jargon and clichés. There’s no end of advice for engineering teams to travel the Industry 4.0 “journey” and reap the promised rewards of greater added-value for their businesses. Worthy advice from management consultants is often accompanied by snappy graphics charting a conveniently neat, linear progression along the data transparency superhighway from zero to digital superhero.
The promised benefits sound simple enough: extract more data from your existing plant and equipment, analyse it to gain better insights which, in turn, inform better operating decisions. Analysing data across your production and logistics operations enables real-time monitoring of the health of machines, predicts and avoids failures before they happen. You make timely interventions to improve overall efficiency and operate at peak performance by minimising unexpected down time. That certainly sounds like a result, doesn’t it?
Gritty Reality
Except, the gritty reality of a production floor is a far cry from the yellow brick road of a digital journey. If you feel daunted, that’s understandable. It’s likely you will have different machines in different places across production and logistics floors that are not connected. Even if your IT systems are not operating entirely separately, your data could come from all sorts of sources that use different communications protocols.
Faced with a sea of information, it’s difficult to isolate the specific factors that are limiting your operating efficiency. Information could just be recorded manually, e.g. on a production targets whiteboard, be stuck in silos, or just get bogged down in bottlenecks.
Operators can also find themselves locked out of PLCs or other systems, such as “legal for trade”. So, they cannot increase the amount of diagnostic data from their legacy systems, even when they replace switched devices with IO-Link sensors or configure edge integrations using IO-Link Masters.
Granular approach
Pragmatically, production and logistics teams are, therefore, much more likely to adopt a granular approach to diagnosing and correcting flaws in their processes as they go. Taking and aggregating information from different systems could be a slow process undertaken only at intervals, or as part of special projects.
Even where there are existing data analysis systems in place, including those that operate at a higher organisational level, the opportunities to adapt them to deliver more data can be limited. There can also be reasons the use of cloud-based systems is undesirable because of data security concerns.
So, what can be done to get around these real-world limitations? How can you circumvent the barriers and end up with a helicopter view of your operations? How do you drill down to really useful and timely information that can inform cost savings and efficiency gains?
Track and Trace Experience
SICK’s software development team set about addressing these challenges by turning to the experience of working with our customers in the logistics industries. An analytics engine had already been perfected with our global customers for almost a decade. It has helped them achieve automated and accurate data transparency to run track and trace applications within their distribution centres more efficiently and provide competitive advantages to their organisations.
The result is an on-premise Field Analytics data intelligence software platform, which can be quickly and easily set up to provide meaningful, application-specific condition monitoring and process insights, independently of an organisation’s existing machinery and systems.
There are three common questions that operators want to find out:
How are my assets performing now?
What are the bottlenecks in my process?
What more could I learn by aggregating data from different systems?
SICK Field Analytics is vendor agnostic. It collects and aggregates data from any source, including sensors, machine controllers and other IIoT devices. The software can be configured to display real-time data, to provide timely alerts and alarms, and to visualise historical trends through powerful dashboard graphics.
Field Analytics
The digitilisation platform can be used in combination with data extracted from a wide variety of existing sources, including sensors from any vendor, PLCS, and smart IIoT edge devices such as Sensor Integration Machines. Where necessary, additional smart sensors and edge devices can be added to machinery or automated systems to extract the data needed. SICK Field Analytics is compatible with most common communications protocols, including Rest API, OPC UA and MQTT.
Operators can set up and trend Key Performance Indicators both historically and in real time. Through real-time alerts, they can react more quickly to production or process anomalies that might otherwise lead to machine downtime.
Field Analytics can, therefore, be used to track overall operating effectiveness. The dashboard features can display historical trends for measurements important to an organisation’s profitability and efficiency, such as compressed air usage.
Powerful Dashboards and Alerts
Organisations can configure their Field Analytics package to better understand the condition of their machinery using powerful dashboard graphics and visual alerts. The data collected will depend on each organisation, but could range from the service status of sensors through to key data about the health of machinery, such as vibration, temperature, or shock.
Measurements from the SICK Multifunctional Flow Meter.
Early users of the system have reported learning surprising new insights, especially when they compare data from different sources for the first time. Or, by inputting a formula for multiplying a consumption measurement by a unit price, e.g. for electricity, operators can get a real-time picture of their operating costs.
For example, SICK customers around the world are now using the system to monitor their compressed air usage to calculate energy consumption. Based on data from SICK FTMg flow sensors, they can set up dashboards for many different parameters and quickly identify and correct energy losses in their operations.
The SICK FTMg measures flow, pressure and temperature simultaneously as gas passes through the flow channel, then uses an on-board algorithm to calculate the energy consumption of the process in kWh.
The SICK FTMg flow monitor is used to calculate compressed air energy consumption.
The SICK FTMg is combined with an on-board Monitoring App to provide the basis of a scalable solution that can target the compressed air energy use of individual machine cells through to entire production or logistics halls. With no programming needed, it can quickly start visualising continuous compressed air data that is easy to use and interpret. As well as enabling more sustainable use of resources, the data insights support better operational efficiency and help achieve reduced carbon targets, even contributing towards ISO50001 Energy Management certification.
In conclusion, there is no need to be overwhelmed. You do have the means to extract greater value from the information you already have across your operations – without costly and time-consuming digitilisation projects, or remote cloud-based monitoring.
Sensors and other devices provide diagnostic information and measurements, right from the heart of machinery. They can be the starting point for building an overall picture of operating health and efficiency. Armed with quality data, useful comparisons and historical trends, you can dispense with the Industry 4.0 theory book, and instead deliver data-driven, ground-up operating improvements.


